
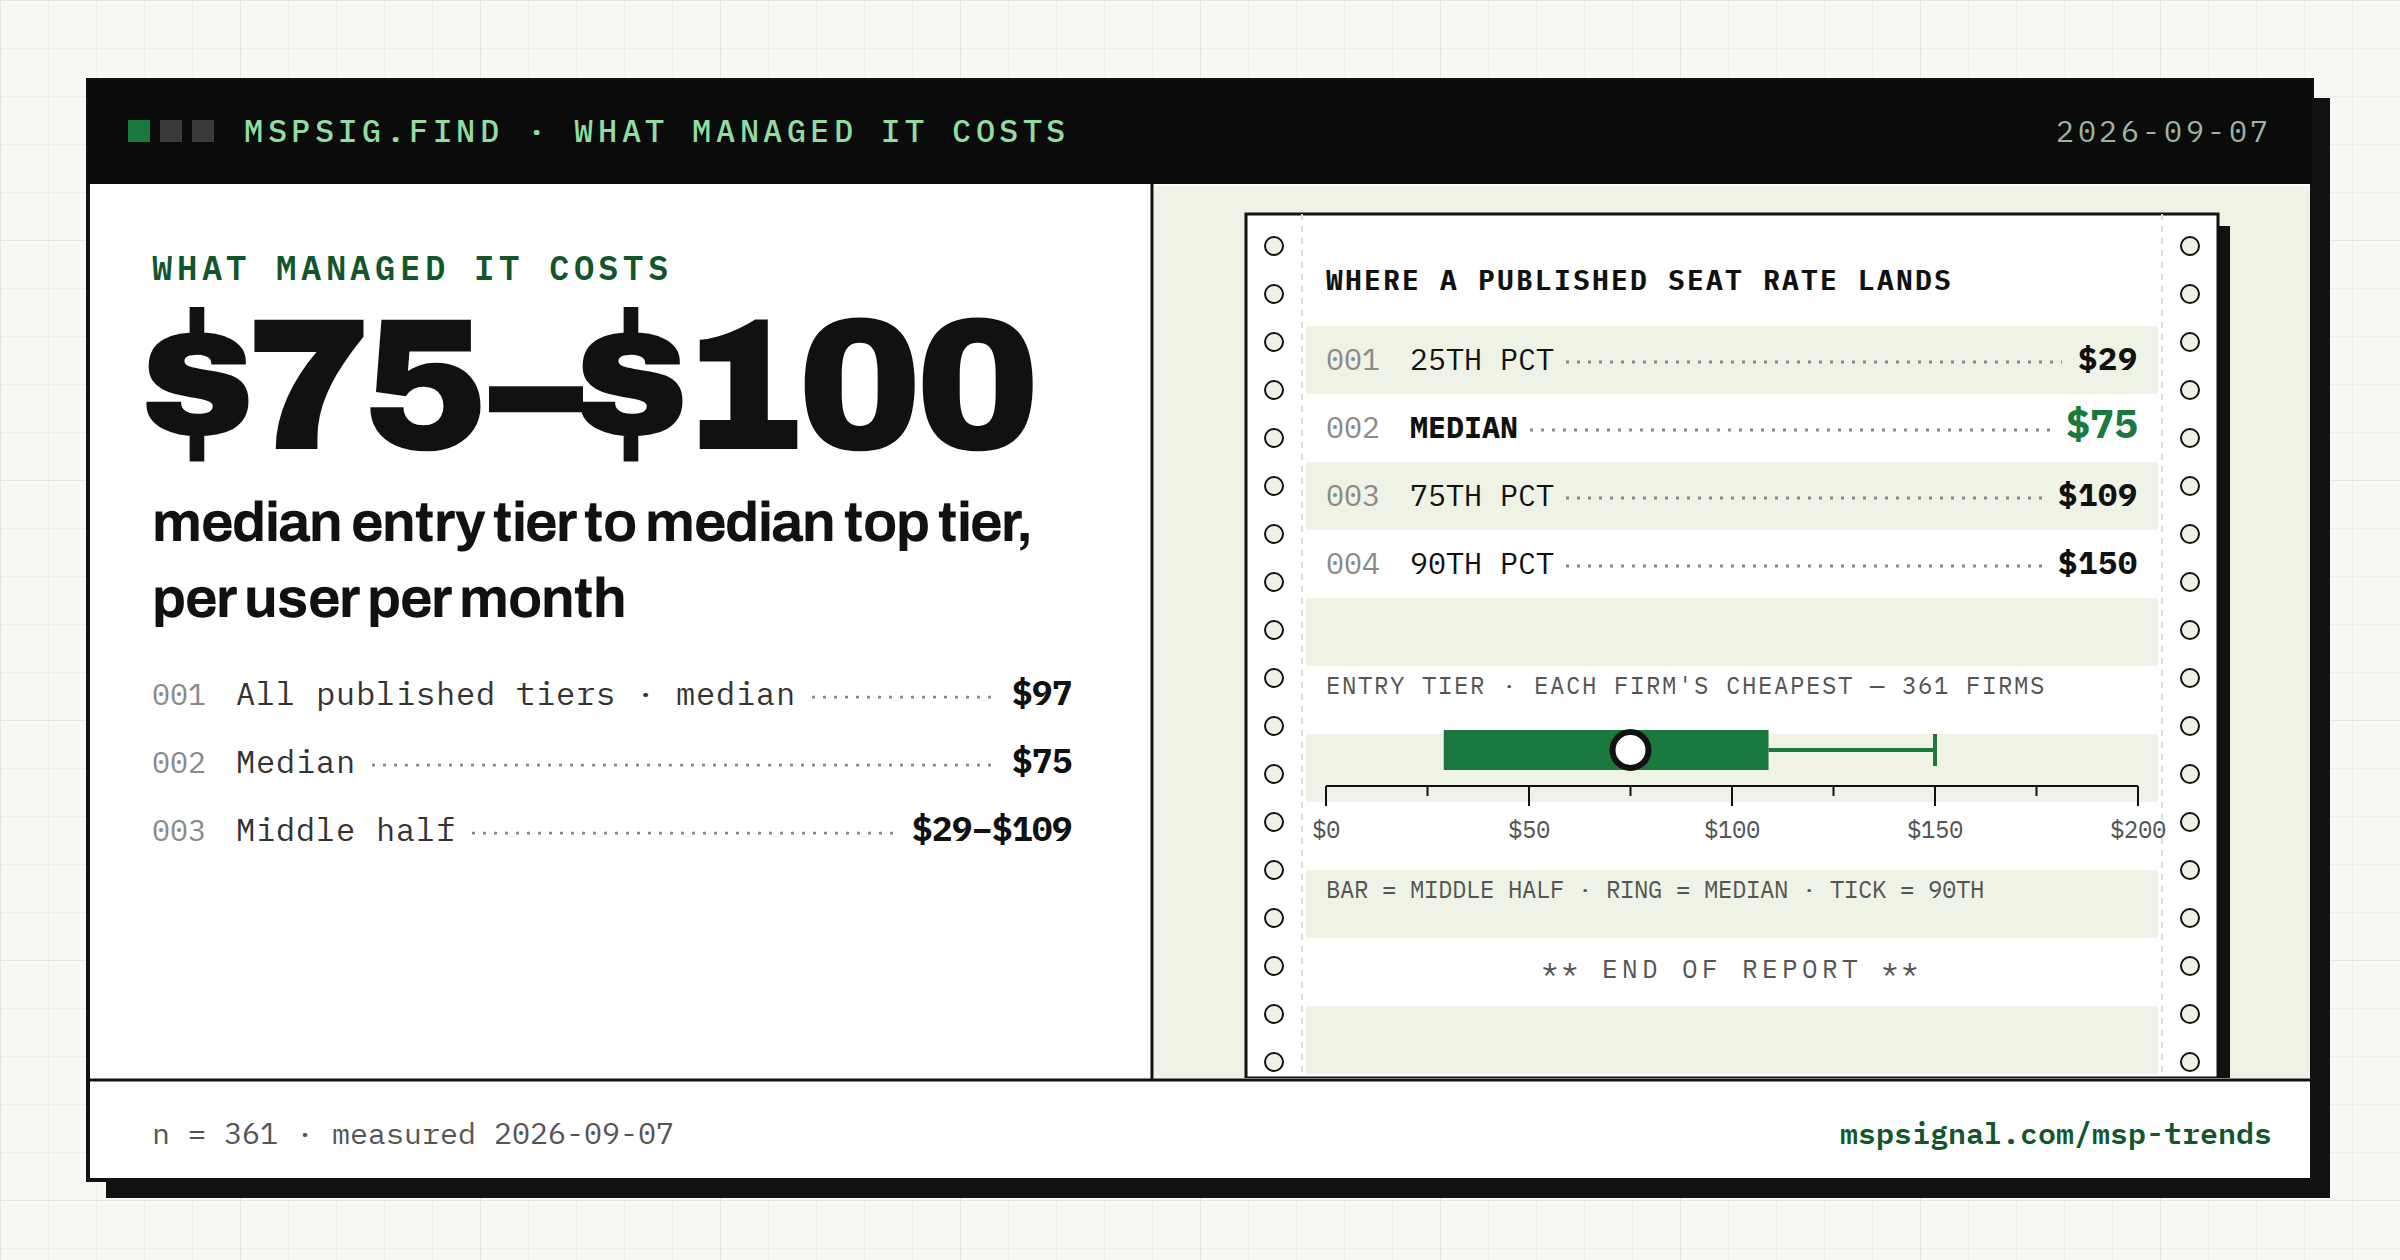
Headline finding · measured 2026-09-07
Managed IT is advertised at $75 to $100 per user per month.
A cost benchmark built from published prices rather than a survey: 361 US providers, 701 published tiers, every figure traceable to a page a buyer can read.
- 25th pct
- $29
- Median
- $75
- 75th pct
- $109
- 90th pct
- $150
- 25th pct
- $40
- Median
- $97
- 75th pct
- $150
- 90th pct
- $200
- Median
- $75
- Middle half
- $29–$109
- Top tenth
- $150+
- Flat monthly
- $500 (273 firms)
- Hourly
- $125 (145 firms)
- Per device
- $49.99 (93 firms)
n = 361 of 39,145 published US providers that publish a per-user, per-month rate, showing 701 separate tiers between them. Entry tier is each firm's cheapest; top tier is each firm's most expensive. Across all 701 tiers the median is $97 a seat. Rates outside $10 to $500 a seat are excluded as extraction errors, 50 rows below, 21 above. Flat, hourly, per-device and per-server rates are quoted separately and never averaged in. Measured 2026-09-07 over the published directory.
Limitations
- This is a benchmark of published prices, not of contracts. Providers who quote only on a call are invisible here, and they are not a random sample.
- Entry tier and top tier are each firm's cheapest and most expensive published per-user, per-month rate. 180 of the 361 firms publish only one tier, so for half the sample those two numbers are the same.
- Every figure on this card is measured over the 39,145 firms the directory publishes. The previous edition measured over a slightly wider set, which is the whole reason the all-tiers median reads $97 here and $99 before, the underlying rates did not change.
- The rates themselves were last extracted on 2026-08-17. This edition re-measures the aggregates, not the source prices.
- Every figure here is an advertised rate. None of it is contract value, and a quote for a real environment will usually land above the entry tier.
- Rates outside $10 to $500 a seat are excluded as extraction errors: 50 rows below and 21 above.
- Rates below about $30 a seat are frequently a single add-on, backup, email security, a helpdesk-only tier, rather than a full managed service, and they pull the lower percentiles down.
- The headcount bands rest on small samples: 137 firms at 1–4 staff, 75 at 5–9, 79 at 10–24 and 28 at 25–49. The 50–99 band has only 14 publishing firms and is not shown.
- Never convert between units. the normalized monthly rate is deliberately unreported wherever a rate cannot be honestly converted to a per-seat figure.
- Pricing has been checked on 21,636 of the 39,145 published firms, or 55.3%. The previous edition quoted 32,365 on a basis we can no longer reproduce, so this figure is stated on its own basis rather than carried forward.
What to do with this
- Buying: ask for the price in per-user, per-month terms and ask what the seat minimum is. Those two questions make three quotes comparable.
- Selling: publishing a starting price puts you in the 2.2% of published providers a buyer can shortlist before the call.
Cite this
MSP Signal, "Managed IT is advertised at $75 to $100 per user per month.", measured 2026-09-07. https://mspsignal.com/msp-trends/managed-it-services-pricing